How efficient your machines are, and which jobs made money
Reports ask for no extra data. OEE, machine load, scrap trend and job profitability come from the production, run hours and downtime your operators already record. If a number cannot be calculated it stays empty and says why; missing data is never counted as zero.
How it works
- 1
Record production and run hours
The operator enters good and scrapped parts on the tablet or by hand. Each machine's planned and actual hours for the day go into the Machine Hours screen; stops are recorded with their reason.
- 2
Set standard times and costs
The standard time in the process plan is what performance is measured against. For profitability you need the machine's hourly cost, the material price per kilogram and the raw weight per part.
- 3
Reports fill in on their own
Reports update as records come in; there is nothing to prepare. Looking empty in the first days is normal; with a few weeks of data the numbers start to mean something.
- 4
Fill in what is missing
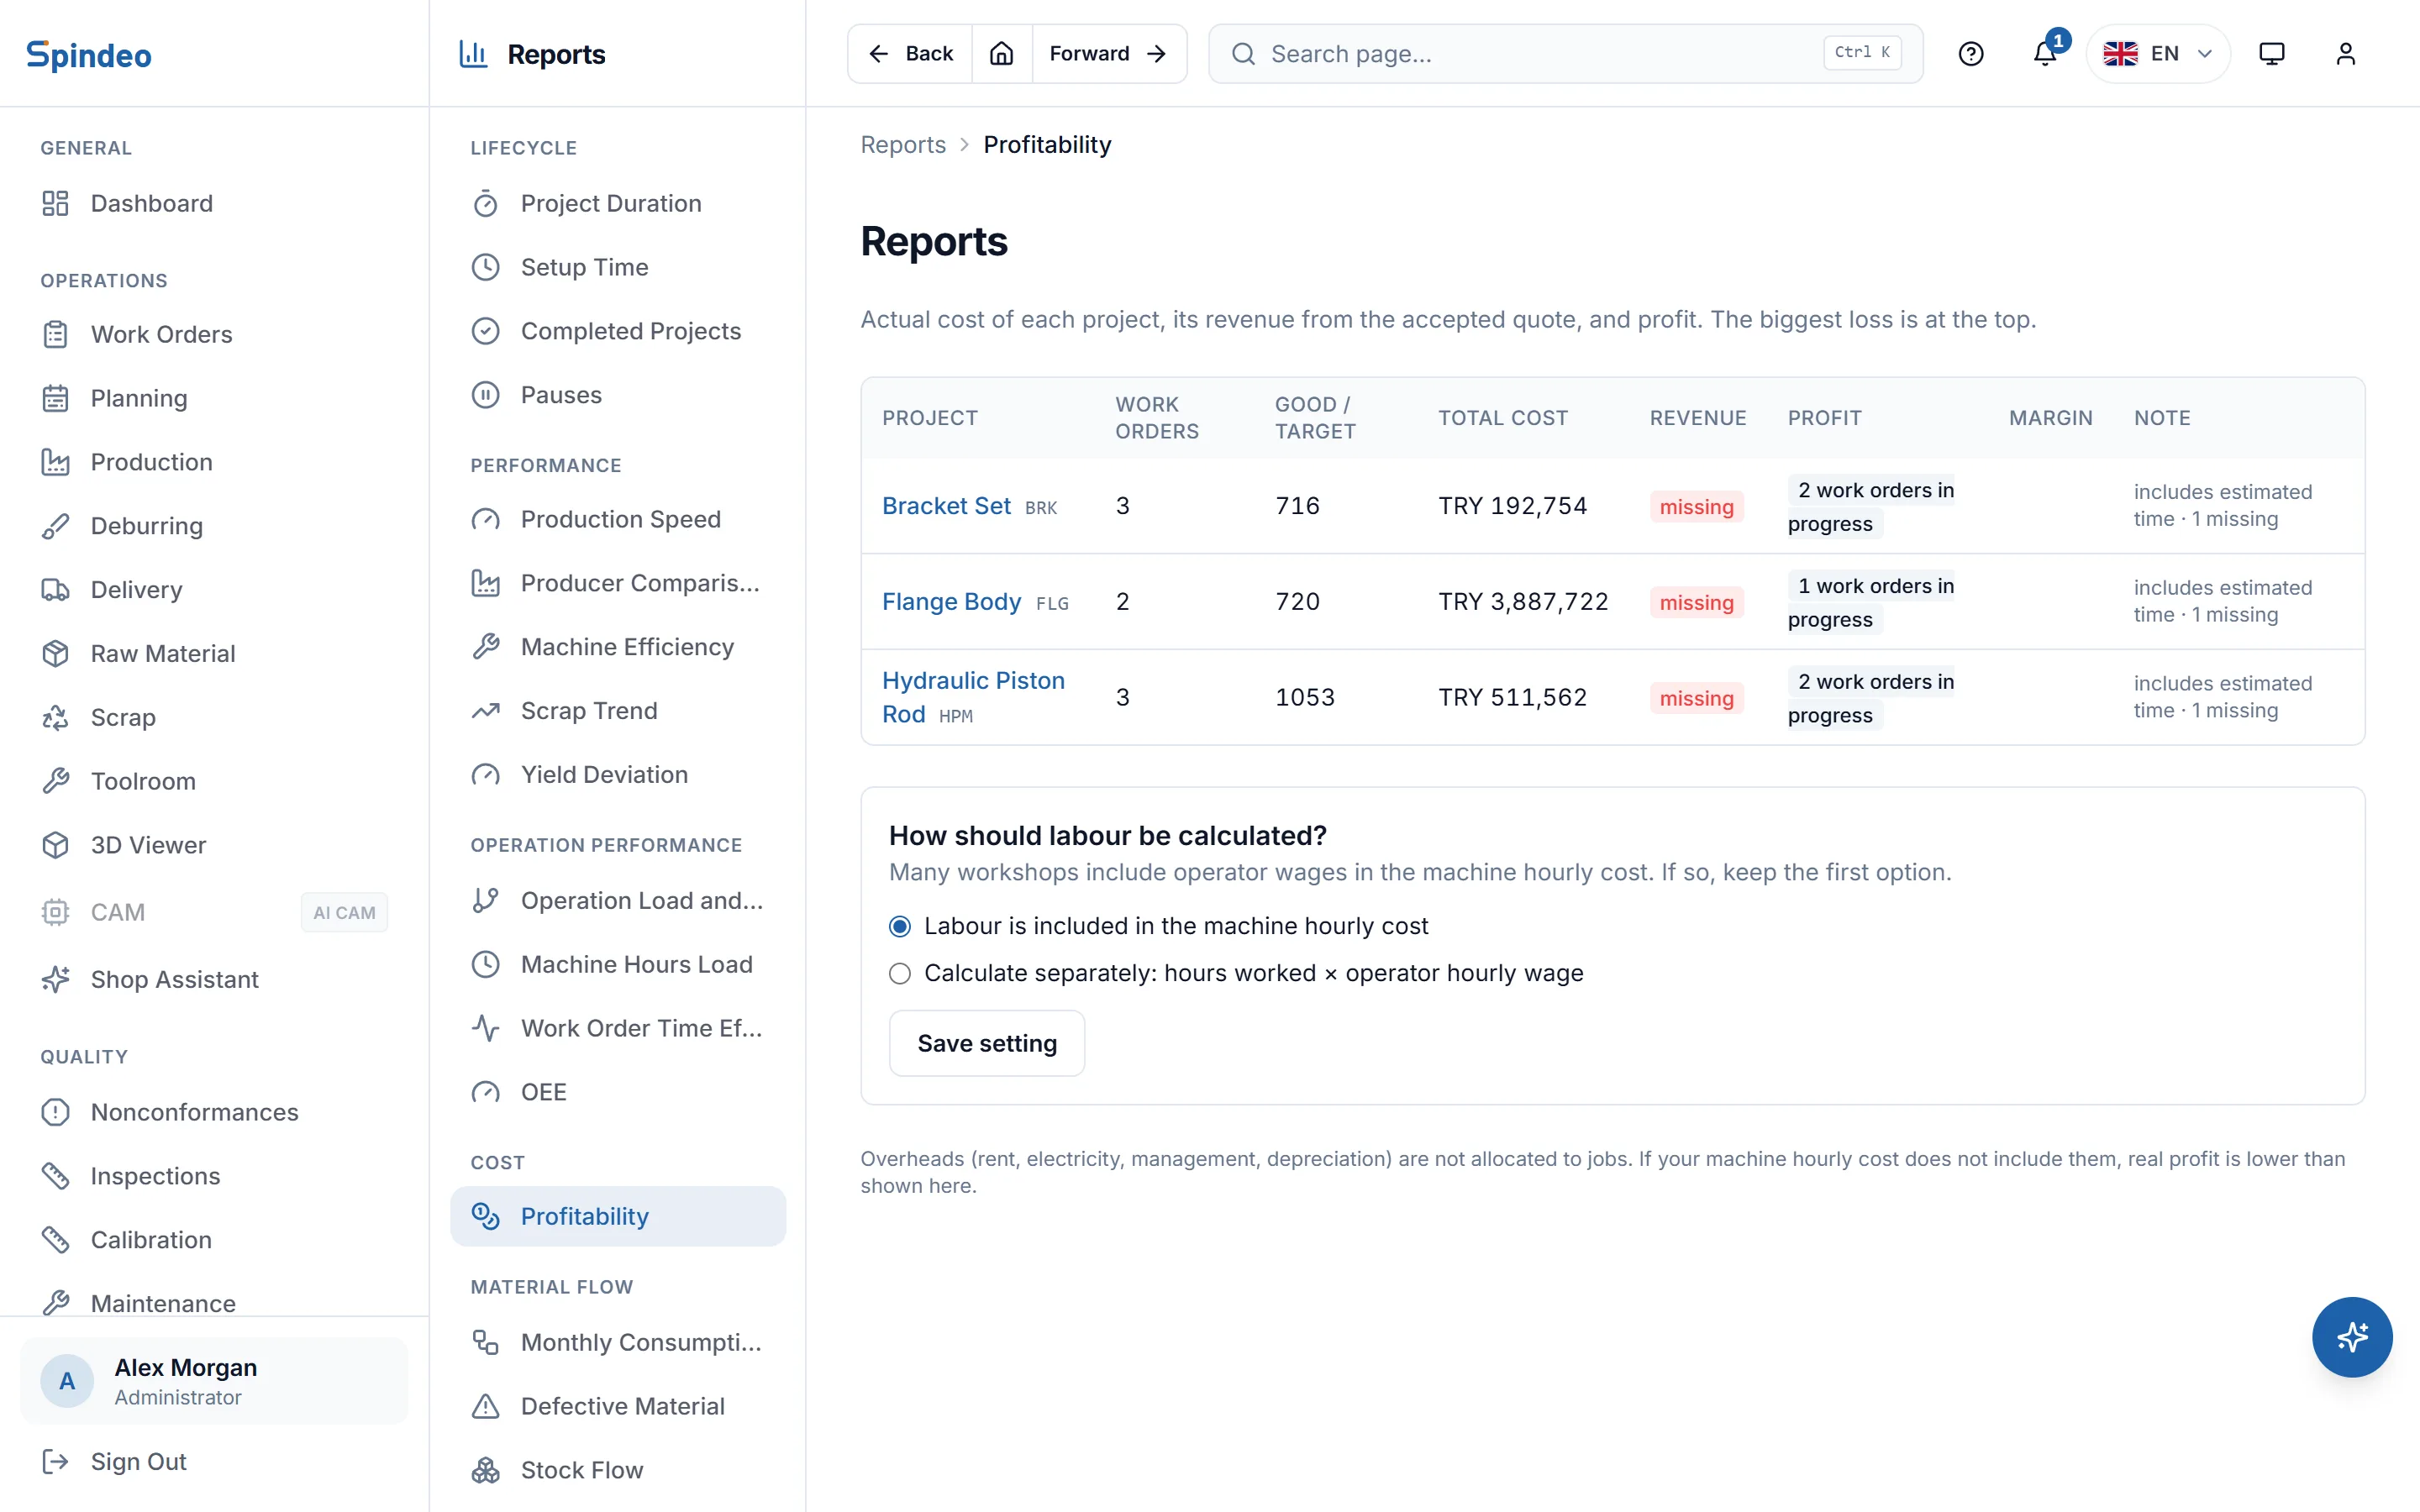
When a rate or a profit cannot be calculated, the reason is shown in its place: no standard time, no hourly cost, no accepted quote. Once you fill the gap, the number appears.
What's included
OEE per machine
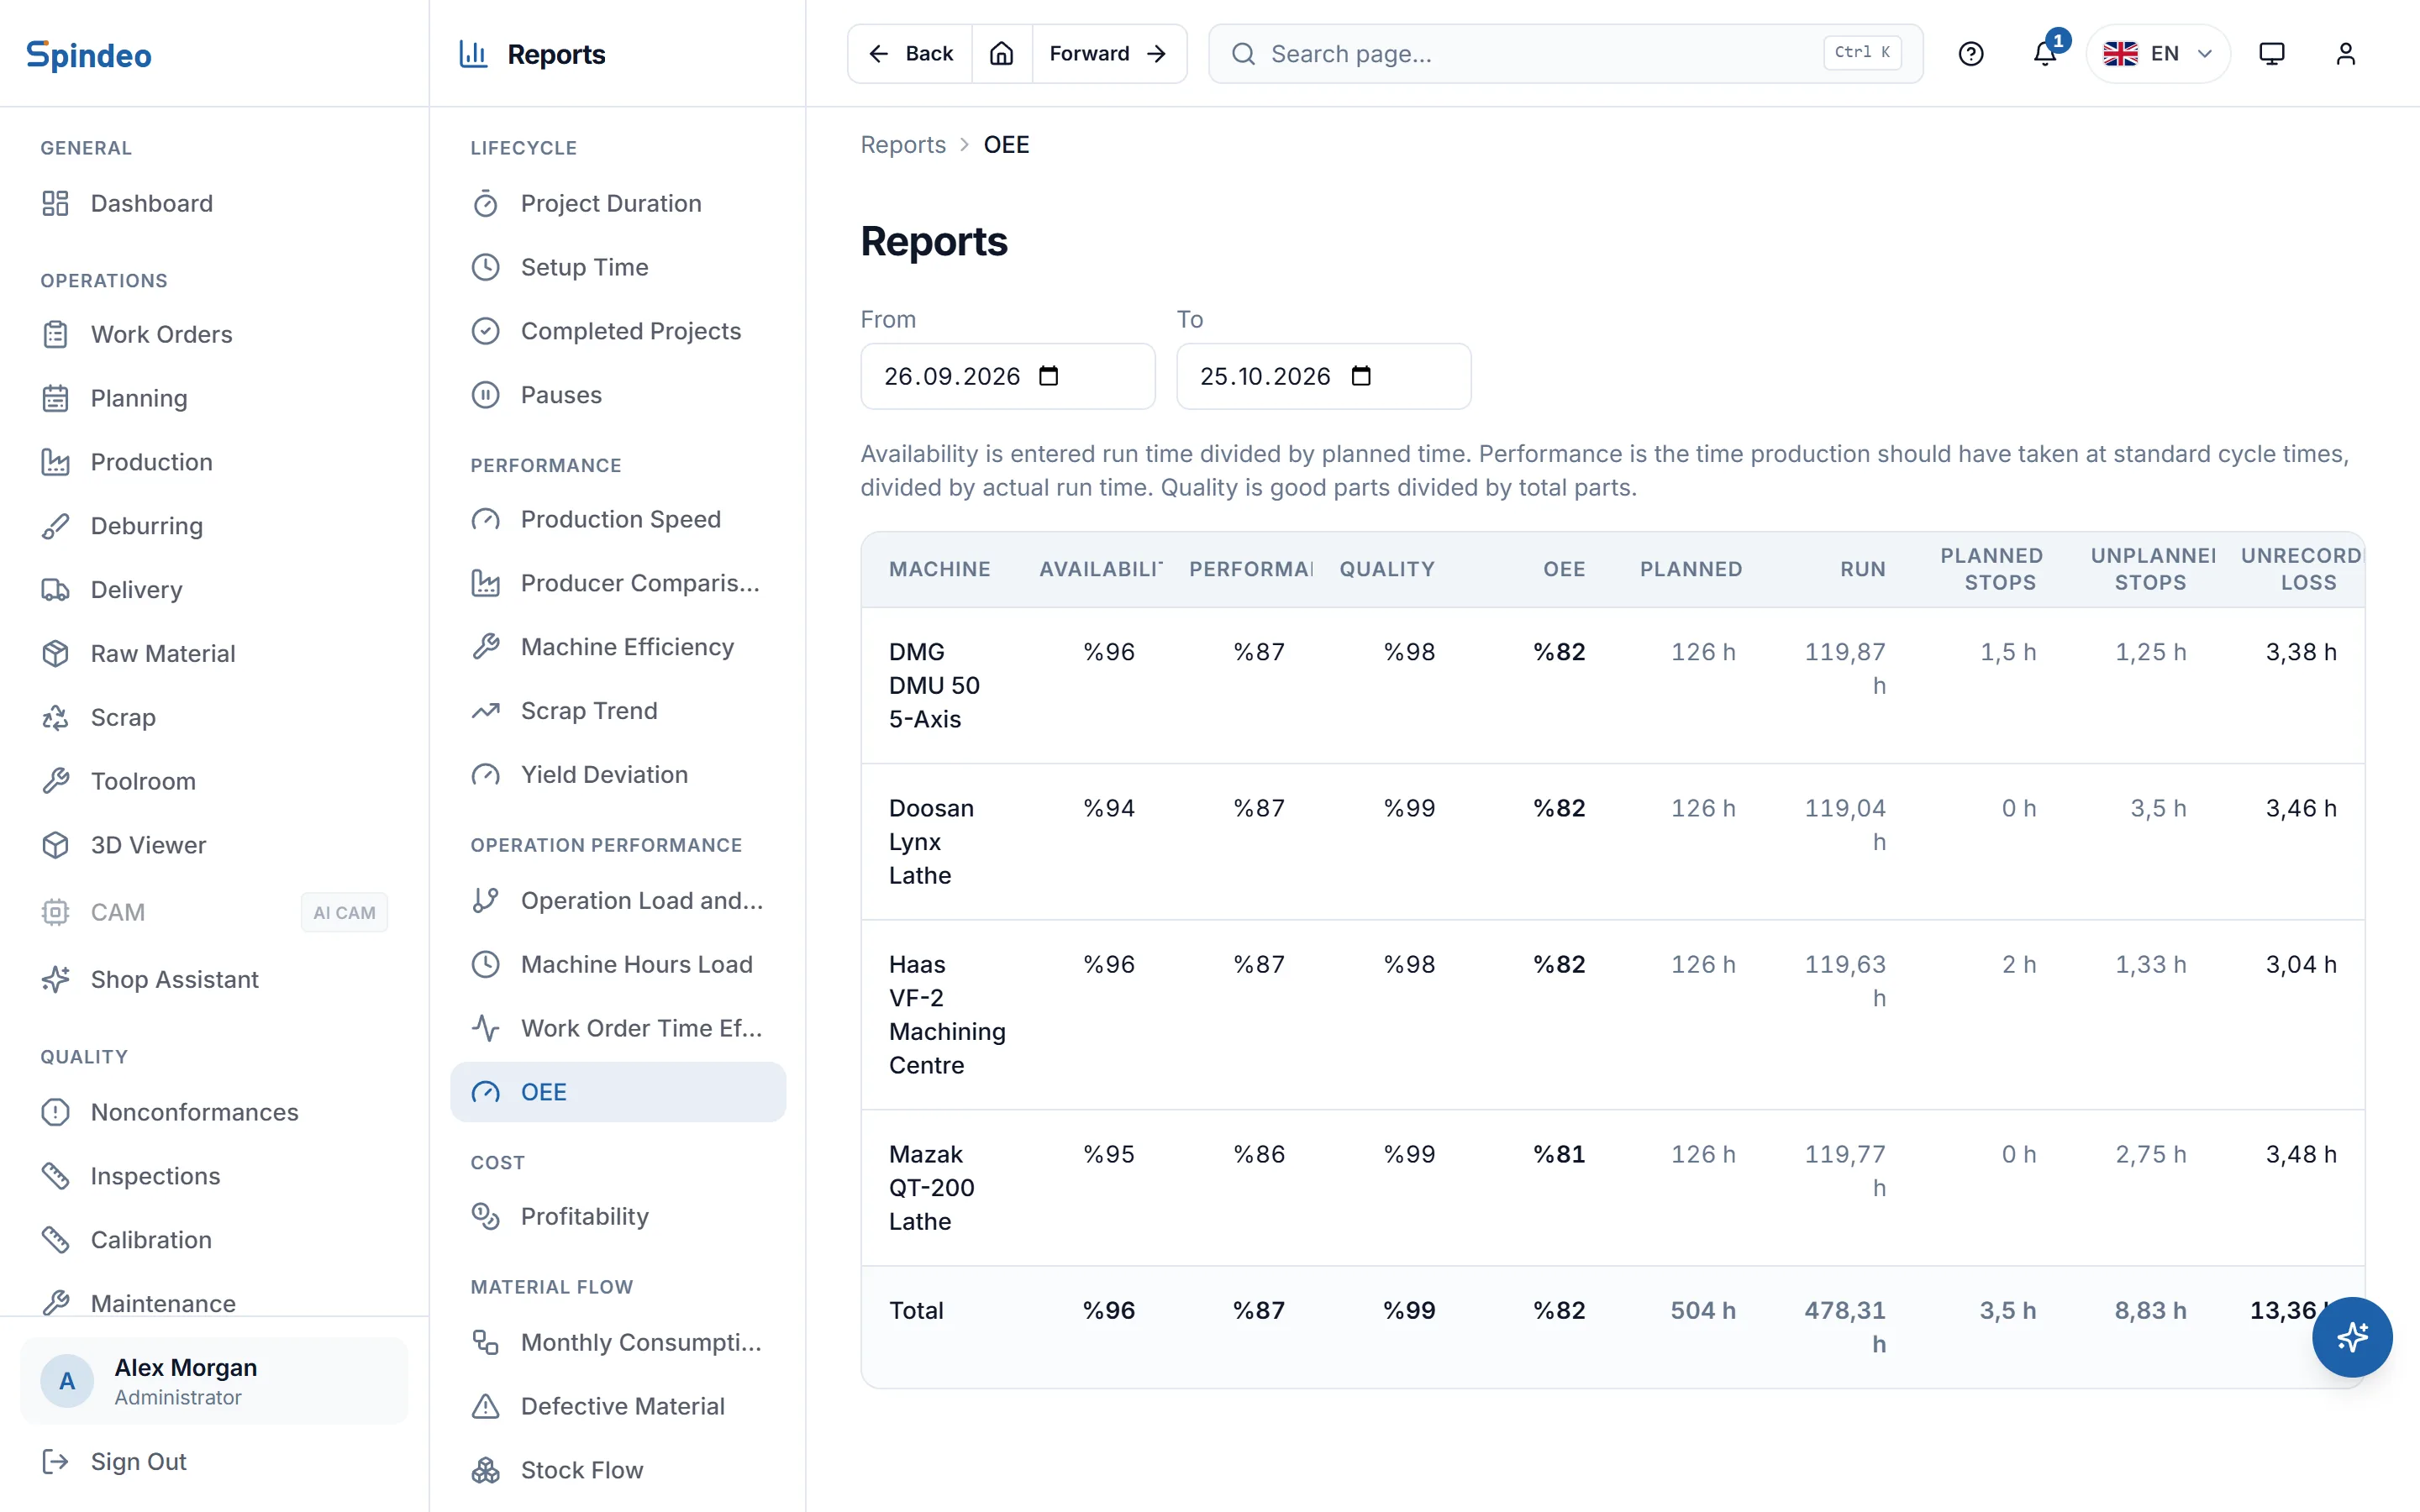
Availability is run time over planned time, performance is the time production should have taken at standard over run time, and quality is good parts over total parts. Rates are ratios of totals, not averages of daily percentages.
Stops explain the loss
Planned and unplanned stop hours are shown separately. Loss that no stop record explains has its own column, so nothing is hidden inside another figure.
Job and project profit
Machine time, labour, material and job-specific costs (outside processing, shipping, tooling) next to the quoted price. A job still running shows no profit; its cost is what has been spent so far.
Machine and operation load
How many hours each machine is loaded, which operation takes the most time, and how long work orders took against standard time, each in its own report.
Scrap and yield
Scrap trend by day, machine and producer comparisons, and the gap between expected and actual parts per piece of raw material.
Project durations
How long projects took, setup times, pauses and completed jobs. With the Traceability and Stock plan, the raw material consumption and stock flow reports fill in too.
Frequently asked questions
Try it in your own workshop
After you sign up you can open the sample workshop: browse the screens on this page in your own browser, then switch to your own data.
Works together with
- Production SchedulingJobs are placed on machines and days; due date warnings come early.
- Machine TrackingEach machine's output, run hours, utilisation and maintenance.
- Production TrackingMachine, operation, good and scrap parts; downtime with its reason.
- QuotesItemised, revised PDF quotes; accepted lines become projects.